How To Use CPR Indicator In Price Action Strategy?

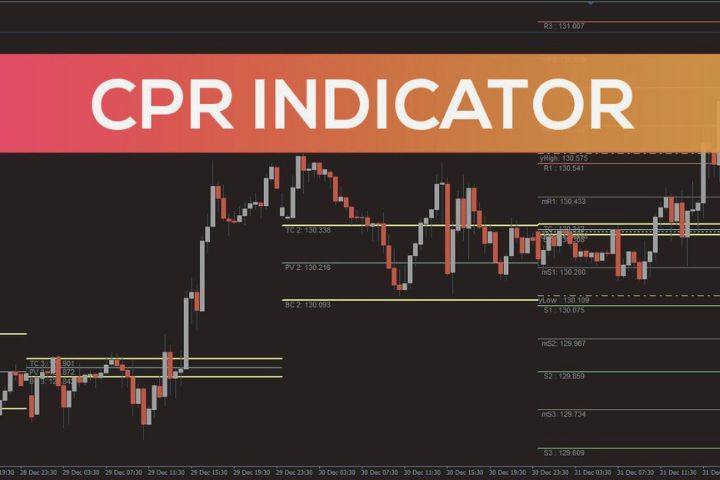
The CPR (Central Pivot Range) indicator is used by intraday traders to analyze price points where they can set up their buy or sell positions. In a CPR in price action strategy, you have to analyze the price movements of stock over time. CPR helps you identify the price range in which stock can rise or fall.
You can understand this concept in detail by taking up the price action CPR course from Upsurge. club. In this article, you can learn the CPR indicator trading strategies along with an example.
Table of Contents
CPR Indicator: Usage and Formula
CPR indicator is used in candlestick charts to identify the support or resistance levels. At the support level, the stock price touches its lowest level and after that, it will only rise. At the resistance level, the price of the stock touches its highest level and it will only fall after that.
The three pivot points in the CPR indicator are as follows:
Pivot Point (PP) = (High Price + Low Price + Close Price) / 3
Bottom Central Pivot Point (BC) = (High Price + Low Price) / 2
Top Central Pivot Point (TC) = (Pivot Point – BC) + Pivot Point
where you can use the last trading day’s high, low, and closing price of stock.
Example of CPR Indicator
For example, if XYZ stock’s last trading day’s high price is ₹100, the low price is ₹75 and the closing price is ₹88. Then, the three pivot points in the CPR indicator are:
Pivot Point (PP) = (100 + 75 + 88) / 3 = 87.66
Bottom Central Pivot Point (BC) = (100 + 75) / 2 = 87.5
Top Central Pivot Point (TC) = (87.66 – 87.5) + 87.66 = 87.82
Case 1: If today the stock opens at ₹89, then it is showing a bullish nature because it is trading above the TC level. You can consider buying this stock and the TC point will act as the support level.
Case 2: If today the stock opens at ₹87, then it is showing a bearish nature because it is trading below the BC level. You can sell the stock and the BC point will act as the resistance level.
3 Trading Strategies in CPR Indicator
Here are the three trading strategies that you should know about while using CPR in price action strategy.
1. Virgin CPR
In virgin CPR, the price of the stock does not cross the three CPR lines and has a 40% chance of not crossing. In this scenario, CPR can either become a strong support or a resistance level.
2. Prices Trading Between the CPR Points
If a stock is trading somewhere between the three CPR points, then the price can go sideways. If the gap between the top and bottom CPR is large, then you can buy the stock at the BC level and you can keep the selling target at the TC level.
3. Prices Trading Above TC or Below BC
If a stock is trading above the TC level, then it indicates a buying action and the TC line will act as a support level. On the other hand, if a stock is trading below the BC level, then it indicates a selling action and the BC will act as a resistance level.
Conclusion
CPR indicator will help you identify the price trend of the stock using three pivot points. It also helps you in setting up the support or resistance levels. If the price of the stock is above the TC, you can buy the stock and if it is below the BC, then you can sell the stock.
You can understand the CPR indicator and dig into its working by taking up the price action CPR course on Upsurge.
Also Read : A Comprehensive Guide to Market Capitalization of Cryptocurrencies


