What bullish Candlestick Patterns Are And How To Use Them To Buy Stocks

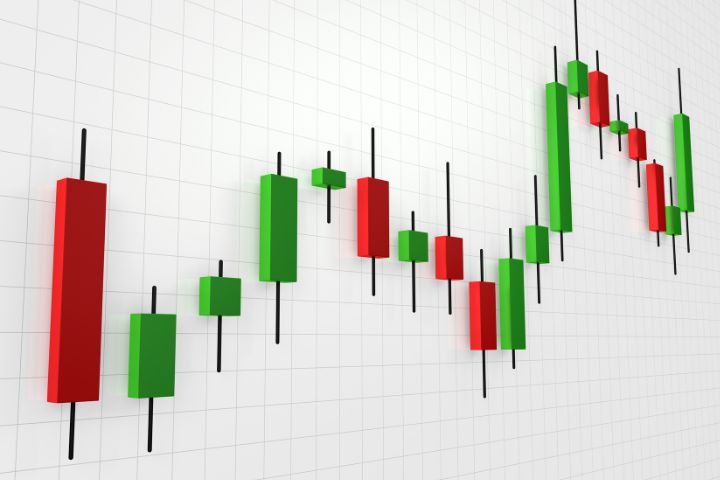
Candlestick patterns are a type of technical analysis used by traders to identify potential buy and sell signals. They were thought to have been developed in the 18th century by a Japanese rice trader called Munehisa Homma. They are called candlestick patterns as they are shaped like candlesticks with a body and wicks at both ends, representing a market’s opening, closing, and high and low prices in a day.
Candlestick patterns can be used to analyse the stock market by tracking price changes and figuring out trends. In this article, we will learn how what bullish candlestick patterns are and how traders can use them to trade stocks.
Bullish candlestick patterns, with examples
There are two basic candlestick patterns – bullish and bearish.
A bullish candlestick pattern indicates that prices are likely to rise. Several patterns are considered bullish and formed when the open price is lower than the close price.
One of the most common bullish patterns is called a hammer, formed when a small body has a long lower shadow. This pattern indicates that buyers were able to push prices up despite significant selling pressure.
Another bullish pattern is an engulfing pattern, which occurs when a candle’s body completely engulfs the previous candle’s body. This pattern suggests that buyers are increasingly confident and that prices will continue to rise.
Finally, the morning star pattern is considered bullish if it occurs after a period of decline. This pattern consists of a small body with long upper and lower shadows, followed by another small body with a long upper shadow.
The morning star pattern demonstrates that buyers are gaining strength and that prices are likely to rebound. These are just a few of the most common bullish candlestick patterns; however, there are many others that traders use to identify potential buying opportunities.
Why are bullish candlestick patterns functional?
Bullish candlestick patterns are functional because they can help you identify potential turning points in the market. For example, if you see a hammer pattern at the bottom of a downtrend, it may indicate that the trend is about to reverse and move higher. Similarly, seeing a shooting star pattern at the top of an uptrend may indicate that the trend is about to reverse and move lower.
How to use the patterns to make informed stock purchases
Many novice investors wonder how experienced traders can consistently make good stock purchases. The answer, in large part, lies in their ability to recognise patterns.
By learning to identify specific patterns, investors can better understand how a stock will behave in the future and make informed decisions about when to buy and sell.
One of the most important patterns to be aware of is the Cup and Handle formation. This pattern typically occurs after a sustained period of downward pressure on a stock price, followed by a period of consolidation. Once the consolidation phase is complete, the stock will often resume its downward trend.
However, savvy investors will recognise this pattern and purchase the stock before it begins its upward trend, earning a tidy profit.
Another basic pattern to be aware of is the Head and Shoulders formation. This pattern is often seen as a sign that a particular stock will experience a significant price drop. By recognising this pattern early, investors can avoid losses and focus on other stocks that may be about to experience an uptick in price.
While many other patterns can be helpful for investors, these are two of the most important. By familiarising themselves with these and other patterns, investors can better understand how prices are likely to move in the future and make more informed decisions about when to buy and sell stocks.
Tips for finding more opportunities
Bullish candlestick patterns are one of the most popular tools used by technical traders to identify potential reversals in the markets. Here are a few tips to help you make the most of your opportunities when using these patterns:
- Look for bullish patterns that form after a prolonged period of sell-off in the markets. These patterns are more likely to signal an actual reversal than a temporary rebound.
- Be patient when waiting for the reversal to occur. Sometimes, the markets can take a few days or weeks to turn around entirely.
- Pay attention to the volume levels when bullish candlestick patterns form. Higher volume levels often signify greater market participation and thus increase the likelihood of a successful reversal.
Following these tips can improve your success when trading with bullish candlestick patterns.
With that said
Technical analysis is a powerful tool that can be used to predict future stock prices, and candlestick patterns are just one type of analysis method. By studying price patterns, traders can make more informed decisions about when to buy and sell stocks. While technical analysis is not 100% accurate, it can help traders minimise their risks and increase their chances of finding opportunities in stock markets.
Also Read : 5G And Edge Computing: Opportunities And Doubts


